PTE口语DI题型例题讲解 线性统计图解题方法
当考生在PTE口语DI题中遇到统计图该如何作答?相较于数据类信息较多且描述逻辑简单的图片,统计图往往让考生很难抓住逻辑重点。羊驼在线老师今天通过一道例题来讲解一下描述重点。
题目:

一、确定框架提取关键词
础模板
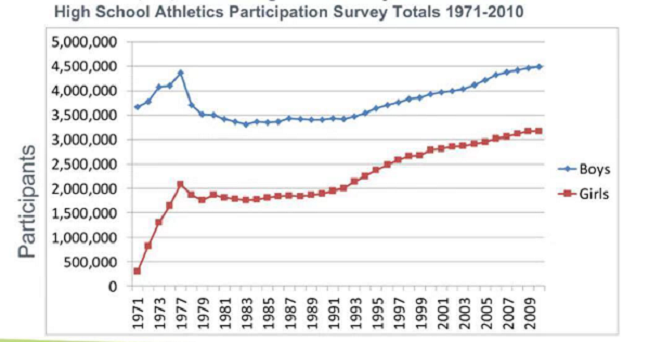
1.标题: High School Athletics Participation Survey Totals;
2.Item: participants from 0 to 5,000,000;
3.Girls: increase from 300,000 degree Centigrade to 3,200,000 degrees Centigrade, minimum in 1971;
4.Boys: increase from 3,500,000 to 4,500,000degrees Fahrenheit, maximum in 1977 and 2009;
5.总结句。
二、根据框架填充内容
这张图是一个比较清晰的线图,那么可以采用线图的分支模板。

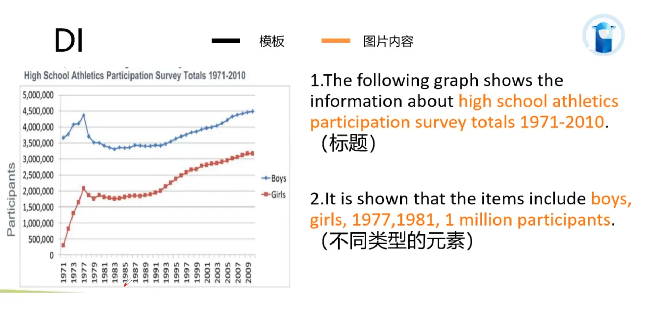
第一句话:作为标题,还是依旧照着念上边的文字部分。The following graph shows the information about high school athletics participation survey totals 1971-2010.
第二句话:我们可以说一些不同类型的元素。像这边两条线的含义,动作的数值,看中的年份,都可以挑选一些自己比较熟悉的部分来说一下。就可以说:lt is shown that the items include boys,girls,1977,1981,1 million participants.
下面三四两句呢就是分别来阐述一下两根线的这个发展趋势。那么首先可以看一下boys这一条线,那我们在讲的过程当中呢,可以看其中的某一小段的这个发展趋势。

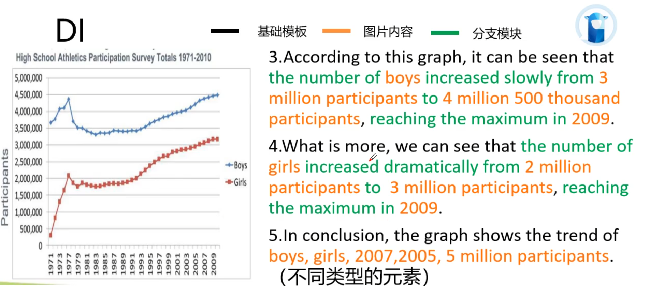
第三句话:According to this graph, it can be seen that the number of boys increased slowly from 3 million participants to 4 million 500 thousand participants, reaching the maximum in 2009.这样就可以了。那当中的像slowly max或者million,我们可以根据不同的线的发展趋势呢来进行调整。
第四句话:我们可以说girls这一根线的发展趋势,同样我们可以挑其中的某一小段来说一下。What is more, we can see that the number of girls increased dramatically from 2 million participants to 3 million participants, reaching the maximum in 2009.同样像当中dramatically包括这边的maxim,可以同样根据图中不同发展趋势进行调整。
第五句话:我们可以同样再把里面的转让对象Boys,Girls再说一遍,包括呢我们可以选择不同的年份以及不同的动作的数值都是可以的。In conclusion, the graph shows the trend of boys, girls, 2007,2005,5 million participants.尽量的多说,尽量的是不一样的,这样的内容肯定没有问题了。


