PTEDI数据图例题讲解 附答题框架
羊驼在线老师今日DI例题讲解更新,本文是数据图例题Commuting time in different regions, Britain的详细讲解,主要从提取关键词选择框架和填写框架两个步骤讲解数据图,来一起了解一下吧。
题目:

第一步:选择框架提取关键词
在作答DI题型的时候,首先建议考生在观察题目的时候就确定下用什么框架,之后根据框架的步骤来从文中挑选出关键词。
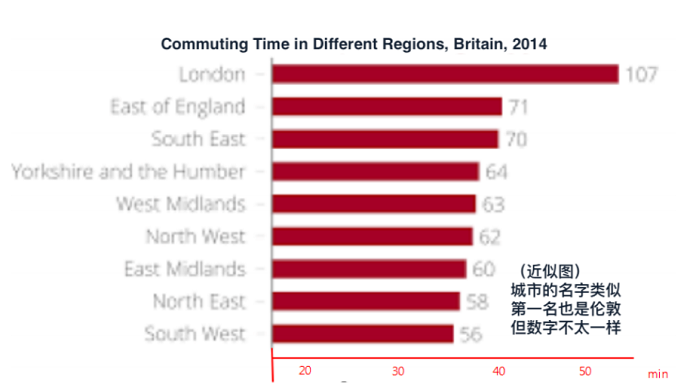
本图是一道经典的数据图,有鲜明的横纵坐标,虽然该图是近似图,但是能了解到整个图片数据信息较多,建议使用基础的数据框架,用最大最小值的逻辑进行描述,下面是提取 关键词示范:
解析:基础框架
1.标题: Commuting time in different regions, Britain
2.Items: 2004, minutes and different countries
3.the highest number is: London, about 107
4.the lowest number is: South west, about 56
5.总结句
第二步:将关键词逐步填入框架中
完整整个DI题型的作答还需要考生整合信息组织语言并读出来。在将关键词填入框架时需要注意选择考生读顺的、好读的部分进行描述,下面羊驼在线老师来示范一下例题的解答:
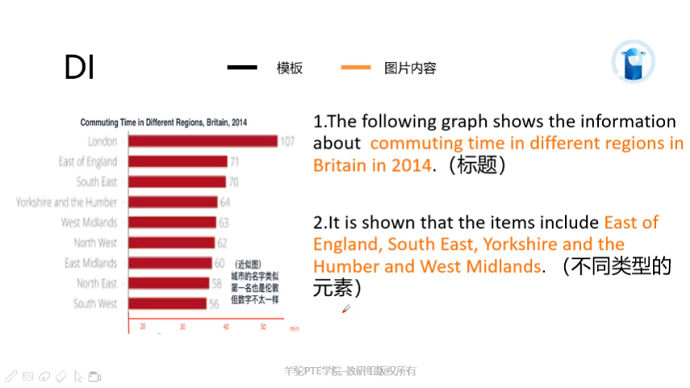
1)标题,图片上方有显眼标题,直接套用进入即可:Committing time in different regions in Britain in 2014.
2)Items,放在第二局整体描述一下图片信息,这类数据图主要可以用横纵坐标的信息:Its show items include east of England,South East,Yorkshire and the Humber and West Midlands.

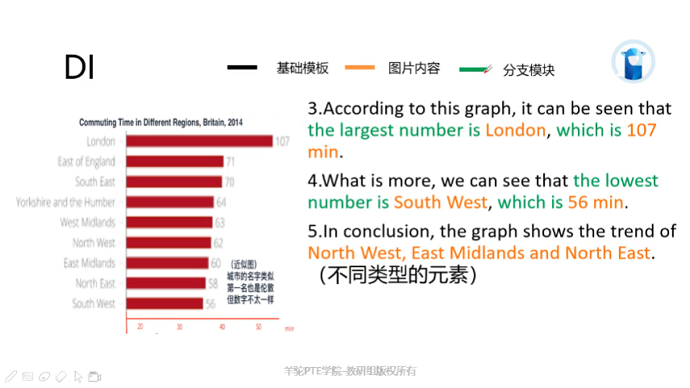
3)第三四两句,采用数值的分值框架,首先是最高值对应数值:According to this graph it can be seen that the largest number is London,which is a one 107 minutes.之后最低值以及对应的对象和数值:What is more,we can see that at the lowest number is South West,which is 56 minutes.
4)最后一句话总结,可以把一些没有讲到过的地区名称放在最后:In conclusion the graph was a trend of North West,East Midlands and North East.


