PTE口语DI地图题Annual change in forest讲解
当考生在PTE口语DI题中遇到地图题该如何作答?相较于数据类信息较多且描述逻辑简单的图片,地图题往往让考生很难抓住逻辑重点。羊驼在线老师今天通过一道例题来讲解一下描述重点。
题目:

一、确定框架提取关键词
地图模板
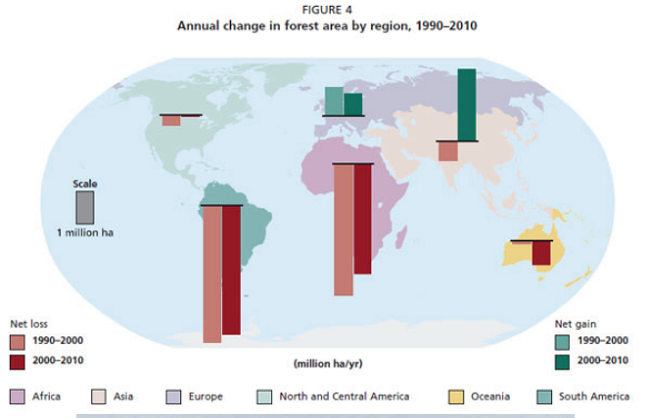
1. Title: Annual change in forest area by region from 1990 to 2010;
2. Items: Afica, Asia, Europe, South America;
3. 方位, net loss in red color;
4. 方位,net gain in green color;
5. 总结句。
二、根据框架填充内容
这是一道地图题,大家直接套用地图题的模板就好。

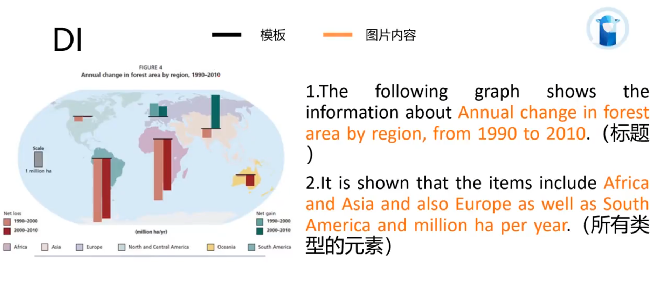
第一句话:我们需要描述一下这道地图题的题目,The following graph shows the information about Annual change in forest area by region, from 1990 to 2010.
第二句话:我们需要描述图中所有微型的元素,大家可以描述一下它的图例。lt is shown that the items include Africa and Asia and also Europe as well as South America and million ha per year.大家注意一下,这个地方有一个文字信息,有一个单位信息,大家一定不要忘记说。
对于我们的第三句话和第四句话来说呢,大家可以看一下我们图中还有什么文字信息没有说到,我们一定要把它说全。

那么我们可以在第三句话和第4句话呢,把左边的文字信息,右边的文字信息之前没有说到的再说一遍。
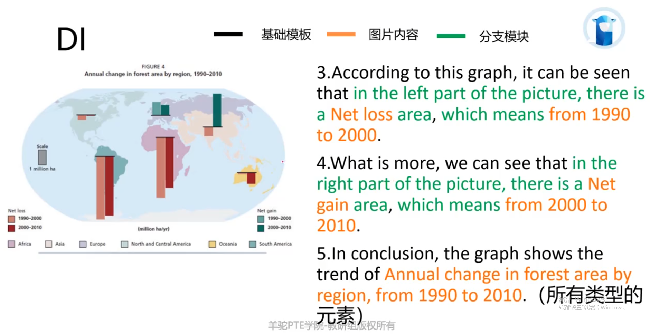
第三句话:我们可以这么说,According to this graph, it can be seen that in the left part of the picture, there is a Net loss area, which means from 1990 to 2000.
第四句话:我们说右边的这个信息就好,What is more, we can see that in the right part of the picture, there is a Net gain area, which means from 2000 to2010.到这里图中的文字信息我们就说的差不多了。
第五句话:最后总结一句,我们可以把题目说一遍,或者大家可以把咱们的图例再说一遍,In conclusion, the graph shows the trend of Annual change in forest area by region,from 1990 to 2010.这样一说的话,图中的文字信息我们描述的差不了。


