PTE数据图框架有哪些?DI提分技巧
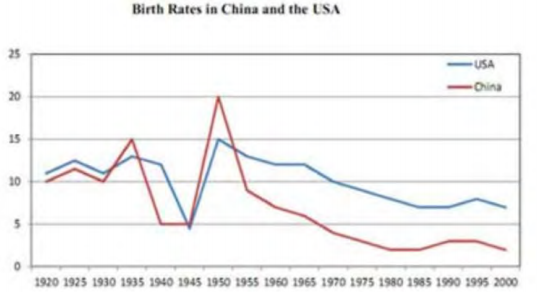
今天羊驼在线老师又来给大家讲解DI题型了!DI描述图片题型解答重点在于提取合适的关键词放入框架中,保持口语流利度和发音准确性。今天的例题Birth rates in China and the USA是一道双线折线图,来看看解答示范吧!
题目:

解析:
基础框架
1. 标题: Birth rates in China and the USA
2. Items: birth rate, year, percent, red, blue
3. The highest number: 20, 1950
4. The lowest number: 4, 1945
5. 总结句
PTE数据图框架答题示范:

本题是一道经典的简单数据图,标题、横纵坐标、数据都较为丰富,可以直接套用框架作答。上图是前两句话的作答示范,黑色字是框架内容,橙色字则是填入的图片内容。
1)标题,直接把正上方标题放到首句当中The following group shows the information about birth rates in China and the USA,;
2)第二句,填充items,可以填three、Year、Percent的横纵坐标内容,甚至还可以填USA China blue red, 可以选择挑选两三个自己比较熟悉的好说的内容。

上图是后三句话的解题示范,黑色为框架内容,橙色字为信息填充,绿色则是分支框架。
3)第三第四句,本题数据丰富,可以选用最大最小值简单描述,直接说the largest number is twenty which is in1950.第4句就是最小值,乳沟没看清也可以说the smallest number is zero.或者the smallest number is 2/the smallest number is by the smallest numbers three.
4)最后,The graph of the trend of twenty five red and.补充未说完的内容,也可以重复标题。


